All About the Visuals: Teaching Visual Communication in Our Courses
Whether through detailed maps, annotated sketches, or dynamic infographics, visual documents can be a key part of the learning process.
When I first went to college, I set aside time every Sunday to call home using a calling card. Years later, when my eldest child went off to college, we struck a new deal: proof of life each week—whether through a text, a call, or even a Snapchat post. In those early weeks, I often received a snapshot of an eye as a quirky but heartfelt update. This personal evolution in our communication methods mirrors a broader cultural shift. While the art of visual communication was once the exclusive domain of artists and graphic designers, today it’s a universal language that we all use.
From Analog to Digital: A Shift in Communication
Our methods of communicating have transformed dramatically over the years. Today, most of us carry a high-definition camera and video recorder in our pockets, along with a suite of apps that help produce, modify, and share visual content. This ubiquitous access to advanced technology has not only increased our reliance on visual forms of communication but also reshaped how we perceive and interact with the world.

In classrooms across disciplines, visuals are now a central tool for both teaching and learning. Whether explaining complex scientific phenomena or outlining design concepts, educators and students alike rely on diagrams, graphs, and sketches to communicate ideas clearly and effectively. Ask any scientist, engineer, or designer to describe their project without using technical jargon—and chances are, they will quickly resort to pen and paper to illustrate their points with arrows, circles, and slopes.
Visuals in the Age of Data and Digital Tools
In today’s data-driven world, the transformation is even more evident. Graphs and charts have become indispensable tools for administrators and researchers alike, grounding decisions in visual representations of digital information. Whether in policy meetings or in classroom discussions, visual data helps us understand (communicate) complex patterns and make informed decisions.

This shift is not limited to a single discipline. In the sciences, engineers, and designers, visuals serve dual purposes: they are both the means to comprehend intricate processes and the product of creative expression. For instance, a student may sketch a design concept, create a computer-aided model, or even test ideas through holographic simulations before proceeding to build a final product with additive manufacturing techniques. These tools are transforming design processes in every field, emphasizing the importance of visual literacy in both learning and professional practice.
Educators are increasingly recognizing that visual communication is both a process and a product. In some disciplines, creating visuals is the end goal. In visual arts like photography, printmaking, or painting, the final product is itself a work of visual communication. In design-oriented fields such as landscape architecture or urban planning, the plans and built environments speak visually long after the initial sketches.
Navigating the Future: Emerging Technologies and Ethical Considerations
As we embrace new tools like generative AI, the landscape of visual communication is evolving even further. These technologies are not only expanding our creative possibilities but also raising important ethical questions. The ease with which digital images can be altered or fabricated challenges us to maintain credibility and authenticity in our visual narratives. Moreover, as we integrate tools like CAD/CAM, GIS mapping, and advanced animation software into curricula, it is crucial to consider issues of accessibility and inclusivity—ensuring that our visual materials are designed for all learners, including those with visual impairments or differing cultural interpretations of imagery.

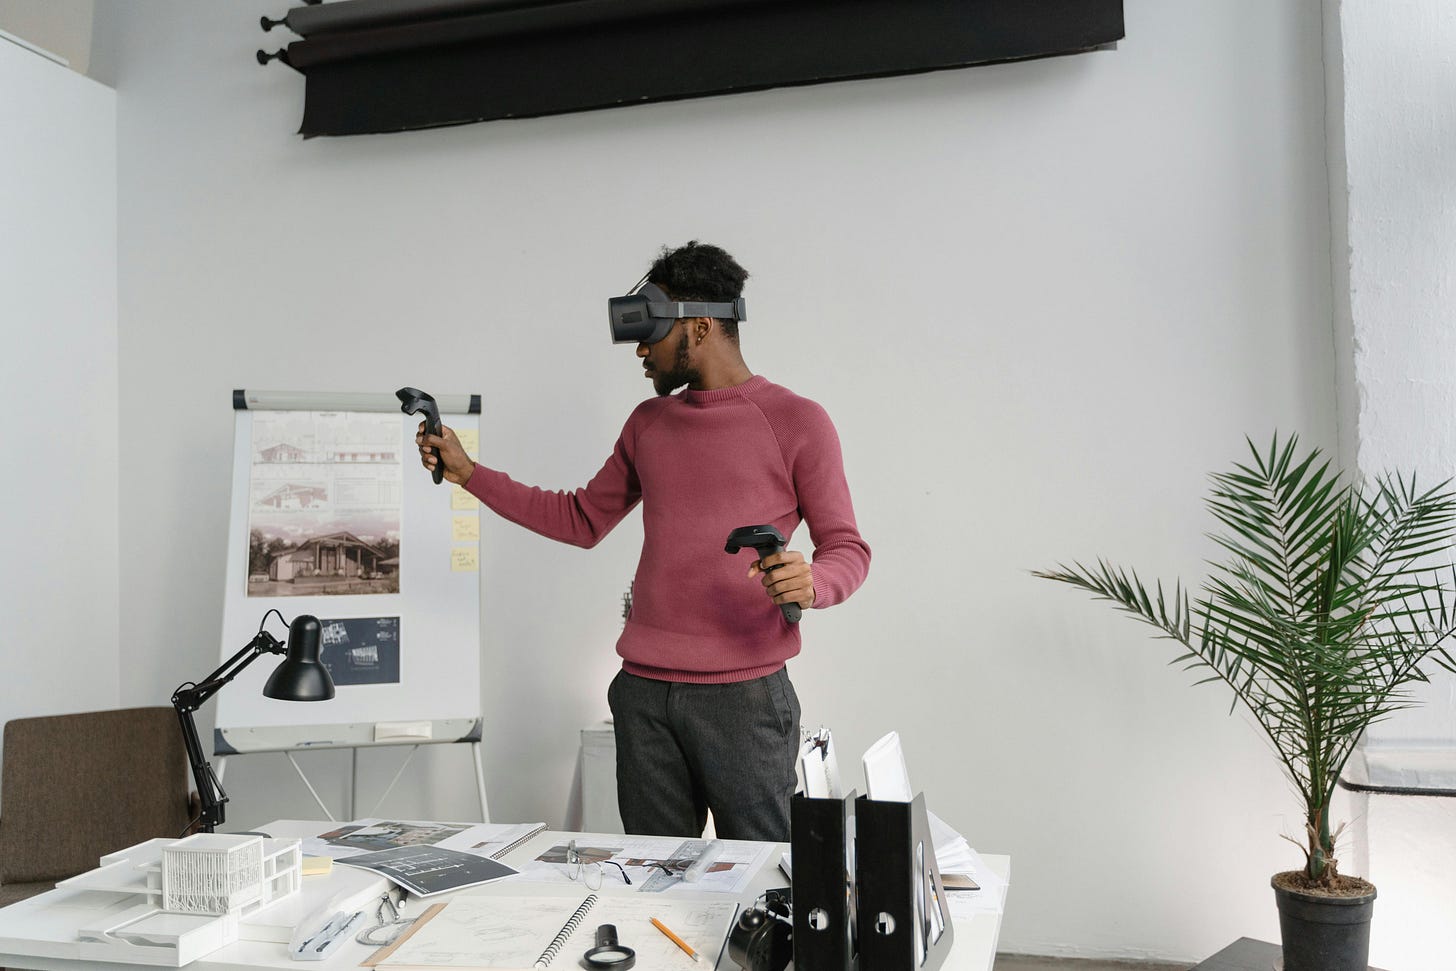
Looking ahead, the emergence of augmented reality (AR) and virtual reality (VR) promises to revolutionize both the creation and consumption of visual information in education. These hybrid and immersive experiences are already beginning to reshape remote and in-person learning environments, offering dynamic ways to engage with content and solve problems collaboratively.
Conclusion
In every classroom, students are not only absorbing content but are also learning to use visual tools to express their ideas. Whether through detailed maps, annotated sketches, or dynamic infographics, these visual documents become a key part of the learning process.
Visual communication is now an integral part of how we learn, design, and communicate with the world. Engaging with visuals in our teaching and learning spaces can deepen learning, but also foster creativity that will help today’s students to navigate the inevitable changes involving visual communication in the future.


We want to hear from you! What are some ways you include visual communication in your courses? What have been successes? What about challenges?